
What We Built and Why
Prediction markets have become a genuine venue rather than an academic curiosity. Kalshi processed $23.8 billion in notional volume during 2025, growth of more than 1,100% year over year, and by mid-2026 monthly volumes exceeded $31 billion. Independent academic research has found useful macro-forecasting information in its prices.
Alongside that growth runs a steady stream of commentary claiming that retail participants can systematically extract returns from these markets, usually by invoking the favorite-longshot bias: the proposition that low-probability contracts are chronically overpriced and can be faded for a repeatable edge.
We wanted to test that against data we collected ourselves rather than against published summary statistics. So we built an autonomous pipeline against Kalshi's public market data endpoints, polling hourly and then every five minutes as contracts approached settlement, and let it run until enough contracts had resolved to support a statistical test.
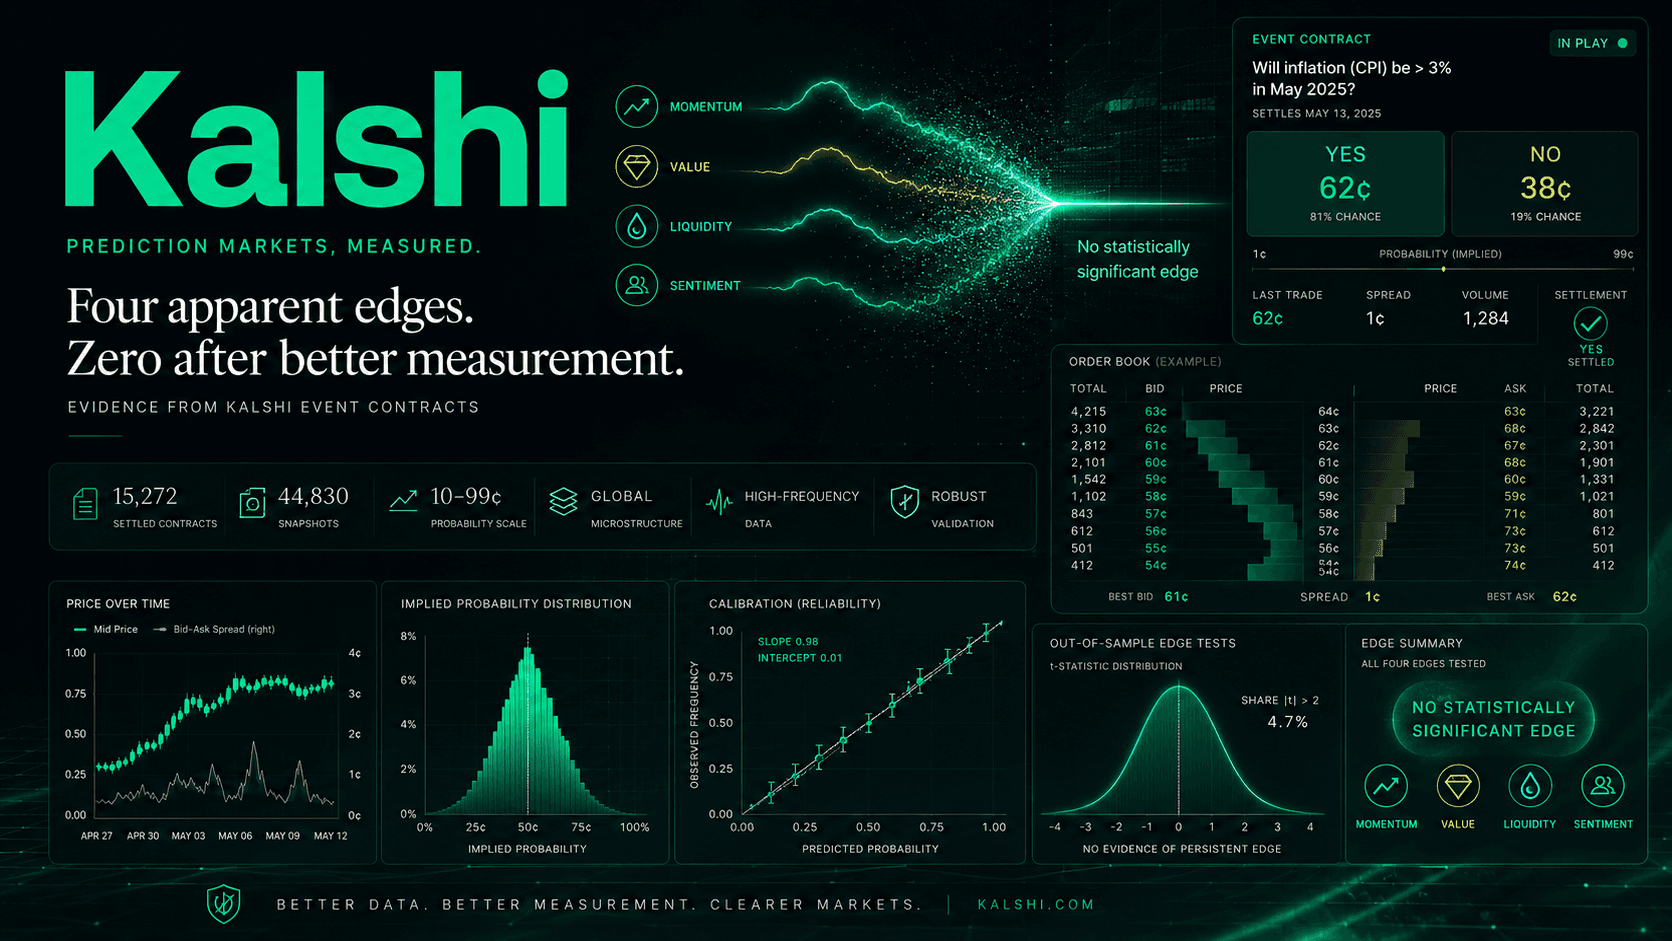
Four apparently meaningful findings emerged during the study. Three included statistically significant pricing signals; the fourth was a dramatic spread result. None survived validation in its original form, and the most instructive failure was our own measurement error, which had already been written into a draft of this article before we caught it. What follows is the collection funnel, the failure catalog, the corrected results, and an honest accounting of what a null result from a 195-contract sample can and cannot establish.
Key Takeaways
- The headline number is not the sample: We archived 15,272 settled outcomes, but only 1,060 had a captured price with a usable close timestamp, and just 195 survived filters for quote age and spread. That 195 supports the calibration result.
- Four findings, none survived validation: Three were statistically significant pricing signals; the fourth was a dramatic spread result. Three traced to stale or lifecycle-sensitive quotes, including reference prices captured 4,199 minutes before settlement.
- Our own spread finding inverted: An early frame showed mean spreads above 70 cents on cheap contracts. Recomputed with medians across the full archive, those bands are among the tightest on the exchange at 1.0 cent.
- Coverage is the binding constraint: 92.8% of settled contracts in our audit had no captured price at all. On player-prop series the invisible share ran 93% to 98%.
- Volume concentration is severe: One series carried 58.6% of recorded volume in our archive; the top three carried 81.3%.
- We did not replicate the favorite-longshot bias, and that is not evidence against it: Published work on 300,000+ contracts does find it. Our filtered sample has dramatically lower statistical power, so failing to detect it says little.
The Collection Funnel
The most important table in this article is the one showing how 15,272 settled outcomes became a 195-contract test. Readers of prediction-market research should demand this disclosure routinely, because the gap between an archive's headline size and its analyzable core is typically enormous and almost never reported.
Table 1: From Archive to Analyzable Sample
| Stage | Contracts | Definition |
|---|---|---|
| Settled outcomes archived | 15,272 | All resolved contracts with a recorded YES or NO result |
| Had a captured price and valid close timestamp | 1,060 | At least one snapshot recorded while the contract was live |
| Reference quote within 3 hours of close | 218 | 101 under one hour; 117 between one and three hours |
| Plus spread of 10 cents or less | 195 | Final calibration sample, spanning nine series |
Stated plainly: AltStreet archived 15,272 settled outcomes, but only 1,060 had a captured price with a usable close timestamp. After requiring a reference quote within three hours of settlement and a spread of ten cents or less, 195 contracts across nine series remained for the final calibration test. Every conclusion in the calibration section rests on that 195, not on the archive total.
Separately, our coverage audit examined the 22 series holding ten or more settled contracts. Among those 14,782 settlements, 1,058 had any captured price and 13,724 (92.8%) had none. The small difference between 1,058 and 1,060 is the handful of priced contracts sitting in series too small to qualify for that audit.
Table 2: Archive Composition
| Data Object | Count | Description |
|---|---|---|
| Markets tracked | 15,685 | Distinct contracts with identity and settlement rule text |
| Price snapshots | 44,830 | Top-of-book quote captures with last trade, volume and open interest |
| Settled outcomes | 15,272 | 4,298 resolved YES (28.1%); 10,974 resolved NO |
| Series monitored | 25 | Curated liquid families spanning weather, macro, sports, media |
We captured top-of-book quotes rather than full order-book depth, a distinction that matters for microstructure work: we can measure the quoted spread but not the size resting at each level, so we cannot speak to depth or market impact. The 28.1% YES resolution rate reflects sample composition rather than any property of the exchange, since many series are mutually exclusive ladders where most individual contracts resolve NO by construction.
A Note on the Listing Universe
An early enumeration pass captured a frame of 82,006 open contracts. In that frame, 89.4% had recorded zero volume and 92.0% had recorded less than 100 contracts of volume. The frame was heavily influenced by one combinatorial esports series containing 80,500 listings, so these percentages describe the sampled listing universe rather than a stable exchange-wide dormancy rate. We narrowed collection to 25 series with demonstrated two-sided activity, and every subsequent figure describes that liquid subset.
Spread Structure, and the Measurement That Fooled Us
Retail commentary frequently asserts that low-priced contracts are effectively untradeable. Our own preliminary measurement, taken from a partial frame early in the study, appeared to confirm it: mean spreads above 70 cents in the cheap bands. We built an entire draft around that finding. It was wrong.
Table 3: Quoted Spread by Price Band (1,873 Liquid Contracts, Latest Quote)
| Price Band | Contracts | Mean Spread | Median Spread | Quotable Inside 10c |
|---|---|---|---|---|
| 1-9c (deep longshot) | 707 | 4.0c | 1.0c | 94.8% |
| 10-34c | 406 | 12.4c | 3.0c | 75.1% |
| 35-64c (tossup) | 327 | 11.8c | 2.0c | 74.3% |
| 65-89c | 118 | 11.6c | 2.5c | 74.6% |
| 90-99c (favorite) | 315 | 2.8c | 1.0c | 95.9% |
The gap between the mean and median columns is the finding. A 12.4-cent mean against a 3.0-cent median means a small population of extreme quotes is dragging the average. Those quotes are not a standing feature of the market; they are contracts observed shortly after listing, before anyone has traded them, when the book holds a placeholder rather than a competitive two-sided market.
Judged by the median, Kalshi's liquid series are tightly quoted at every price level, including the deep longshots that commentary treats as inaccessible. This does not mean cheap contracts are costless to trade—see the fee discussion below—but the bid-ask is not the barrier it is usually described as.
Where Two-Sided Markets Actually Exist
Aggregate spread statistics obscure enormous variation between contract families.
Table 4: Tradeability by Series (Selected)
| Series | Domain | Contracts | Median Spread | Mean Spread | Inside 10c |
|---|---|---|---|---|---|
| KXMLBGAME | Baseball game winner | 88 | 1.0c | 1.5c | 100.0% |
| KXHIGHNY | Daily temperature | 54 | 1.0c | 1.1c | 100.0% |
| KXLLM1 | AI model benchmark | 35 | 1.0c | 0.9c | 100.0% |
| KXRT | Film review scores | 193 | 1.0c | 1.9c | 99.0% |
| KXAAAGASW | Retail gas prices | 46 | 1.0c | 1.7c | 95.7% |
| KXMLBHR | Player home run prop | 458 | 2.0c | 4.6c | 93.2% |
| KXNPBGAME | Japanese baseball | 54 | 3.5c | 18.8c | 70.4% |
| KXMLBTB | Player total bases prop | 221 | 4.0c | 22.5c | 59.3% |
Macro, weather, media and game-level contracts are quotable at one cent essentially all of the time. Player-level proposition contracts are the ragged end, with mean spreads up to 22.5 cents against a four-cent median. That divergence is diagnostic: props are listed days before the event, sit untouched with placeholder quotes, and only attract competitive liquidity near game time.
Volume Concentration
Within our archive, three series accounted for 81.3% of all recorded volume, led by baseball game-winner contracts at 58.6%, cricket at 13.1% and an AI benchmark series at 9.6%. For an allocator, the practical point is that available capacity is a function of the specific contract family required, not of the exchange's aggregate activity.
The Fee Structure Is the Real Cost
Under Kalshi's standard schedule for applicable markets, the general fee is 0.07 x C x P x (1 - P), rounded up to the nearest cent, where C is the number of contracts and P is the price in dollars. Kalshi's documentation notes that some markets carry different schedules and that maker fees apply in some cases.
Table 5: Illustrative Fees Under Kalshi's Standard Schedule
| Contract Price | Per-Contract Fee at Scale | As % of Price | Single-Contract Order (Rounded Up) |
|---|---|---|---|
| $0.05 | $0.0033 | 6.7% | $0.01 (20% of price) |
| $0.20 | $0.0112 | 5.6% | $0.02 (10% of price) |
| $0.50 | $0.0175 | 3.5% | $0.02 (4% of price) |
| $0.95 | $0.0033 | 0.4% | $0.01 (1% of price) |
Two observations follow. First, expressed as a share of contract price, the fee burden is heaviest on cheap contracts: 6.7% of a five-cent contract versus 0.4% of a ninety-five-cent one. Second, the round-up imposes a one-cent-per-order floor that disproportionately penalises small orders in low-priced markets, where a single-contract trade can face a fee equal to 20% of the position.
This matters for interpreting the favorite-longshot literature. With median spreads near one cent, fees rather than bid-ask are the dominant transaction cost on this exchange, and they fall most heavily exactly where longshot buyers operate. A round-trip figure assumes two executions at the same reference price; an actual exit fee depends on the exit price.
The Failure Catalog
Four apparently meaningful findings emerged during this study. Three included statistically significant pricing signals; the fourth was a dramatic spread result. None survived validation in its original form, and they failed in different ways, which is what makes the catalog useful.
Table 6: Apparent Edges and Why They Failed
| Apparent Finding | Initial Strength | Diagnostic | Failure Mode |
|---|---|---|---|
| Broad favorite-longshot pattern | 33-point gap at 46.4c implied | Wilson intervals, then reference-age filter | Seven of eight buckets never significant; survivor failed on quote age |
| Run-production series miscalibrated | z = -3.91 across 109 contracts | Extended collection to 170 contracts | Sampling instability: decayed to z = +0.28 under filtering |
| Total-bases series underpriced | z = +3.90 across 110 contracts | Manual inspection of 15 contracts | Every reference quote captured 4,199 minutes before settlement |
| Wide spreads on cheap contracts | 70c+ mean spreads below 35c | Full-archive medians rather than partial-frame means | Lifecycle-sensitive quotes distorting the mean |
All four apparent edges failed data-quality or sampling validation. Three were directly attributable to stale or lifecycle-sensitive quotes; the fourth disappeared as the sample grew and filters were applied. Documenting several distinct routes to false alpha is more useful than attributing everything to one cause.
The mechanism behind the three timing failures is worth stating precisely. Contracts are listed well in advance of the event they price, and during that dormant window the book carries an uncontested placeholder quote. Our pipeline selected each contract's reference price as the snapshot nearest one hour before close, which worked for daily macro and weather contracts but captured the placeholder for player props listed days ahead. Manual inspection of fifteen total-bases contracts found every reference price recorded 4,199 minutes before settlement, with spreads as wide as 73 cents.
Coverage: The Constraint Nobody Reports
The deepest problem surfaced only when we audited the join between settlement records and price records directly. Settlement outcomes are cheap to capture after the fact; prices must be recorded while the contract is live.
Table 7: Settled Contracts With No Captured Price
| Series | Settled | With Any Price | Invisible Share |
|---|---|---|---|
| KXMLBHR | 5,471 | 367 | 93.3% |
| KXMLBKS | 3,306 | 195 | 94.1% |
| KXMLBTB | 3,048 | 162 | 94.7% |
| KXT20MATCH | 402 | 12 | 97.0% |
| KXHIGHNY | 162 | 42 | 74.1% |
| KXTOPMODEL | 42 | 18 | 57.1% |
| All audited series | 14,782 | 1,058 | 92.8% |
Roughly 7% of settled contracts in our audit ever had a price recorded. None of this surfaces as an error; the analysis simply runs on whatever subsample happens to exist. This is the finding we would most want another researcher to take away: the binding constraint on independent prediction-market research is whether your collector was running, at sufficient frequency, during the window when the contract was actually being priced.
In the Correctly Timed Sample, We Found No Significant Miscalibration
Applying both filters produces the study's result. We tested per-series calibration using calibration-in-the-large, which accounts for each contract carrying a different implied probability. Under the null that the crowd is calibrated, expected YES resolutions equal the sum of implied probabilities, with variance equal to the sum of p(1-p).
Table 8: Per-Series Calibration, Spread Inside 10c and Reference Within 3 Hours of Close
| Series | Domain | Settled | Mean Implied | Realized YES | z-score |
|---|---|---|---|---|---|
| KXAAAGASW | Gas prices | 25 | 58.1c | 60.0% | +0.60 |
| KXRT | Film review scores | 30 | 62.6c | 63.3% | +0.39 |
| KXTOPSONG | Music charts | 26 | 4.3c | 3.8% | -0.33 |
| KXTOPALBUM | Music charts | 11 | 0.9c | 0.0% | -0.32 |
| KXHIGHNY | Daily temperature | 36 | 17.0c | 16.7% | -0.28 |
| KXBILLBOARDRUNNERUPSONG | Music charts | 17 | 6.4c | 5.9% | -0.28 |
| KXTOPMODEL | AI model rankings | 18 | 11.5c | 11.1% | -0.22 |
| KXLLM1 | AI benchmarks | 12 | 17.0c | 16.7% | -0.16 |
| KXTRUMPSAY | Political speech | 20 | 35.1c | 35.0% | -0.10 |
Nine series, 195 settled contracts, no z-score exceeding 0.60 in absolute value. Some individual results are close: political speech contracts implied 35.1% and realized 35.0%; weather implied 17.0% and realized 16.7%.
What This Result Does Not Establish
A null result on 195 contracts across nine deliberately-selected liquid series is weak evidence. It cannot rule out an effect of the size reported in larger studies, it does not generalize beyond the series tested, and it addresses calibration only—not price efficiency, informational efficiency, or the tradability of any strategy. Our reference price is a mid-quote, not a modeled fill.
Related Research, Including Work That Cuts Against Us
Independent research on Kalshi has advanced considerably, and readers should weight it above a study of this size.
A working paper by Constantin Bürgi, Wanying Deng and Karl Whelan, "Makers and Takers: The Economics of the Kalshi Prediction Market," analyzing transaction-level data on over 300,000 Kalshi contracts, reports that prices are informative and become more accurate as markets approach closing, but display a clear favorite-longshot bias: low-price contracts win far less often than required to break even after fees, while high-price contracts win more often and yield small positive returns. The same work finds makers earn higher returns than takers. That is a substantially better-powered test than ours, and we did not replicate it. The most likely explanation is that our filtered sample is too small to detect an effect of that magnitude, not that the effect is absent.
A second study, using 292 million trades across 327,000 contracts on Kalshi and Polymarket, decomposes calibration into a universal horizon effect, domain-specific biases, domain-by-horizon interactions and a trade-size scale effect, together explaining 87.3% of calibration variance. It reports persistent underconfidence in political markets, where prices are compressed toward 50%. Two implications matter here. Calibration is not a single property of an exchange but varies by domain and by time to expiry—which independently supports our methodological point that when you measure determines what you find—and any claim that "the market is calibrated" is too coarse to be meaningful.
On the forecasting side, a National Bureau of Economic Research working paper by Diercks, Katz and Wright found that Kalshi's median and mode had a perfect record on the day before FOMC meetings, a statistically significant improvement over Fed funds futures. The same paper found Kalshi's inflation and unemployment forecast errors were close to Bloomberg consensus rather than better than it. A stronger claim in circulation, that Kalshi's inflation forecasts carry roughly 40% lower mean absolute error than consensus, comes from research authored by Kalshi itself and should be weighted accordingly. Our results are consistent with the general conclusion that these prices carry real information, though our nine-series sample is not a replication of any macro forecasting exercise.
What This Means for Allocators
Our filtered sample provides no evidence of a simple, broadly harvestable calibration edge. That does not mean Kalshi offers no trading opportunities; larger studies identify systematic effects conditional on price, execution role and time to expiry. For allocators, the more straightforward use case may be targeted risk transfer rather than assuming a generic prediction-market alpha premium.
Traditional macro risk management relies on proxy instruments: TIPS for inflation, index puts for drawdown, crude futures for geopolitical disruption. Every proxy introduces basis risk, the possibility that the hedging instrument decouples from the variable being hedged. A fund hedging conflict risk through crude futures remains exposed to supply decisions and growth expectations that move oil independently of the event.
Event contracts can reduce that decoupling by settling on a specific enumerated outcome, with full collateralisation and no variation margin. They do not eliminate basis risk. Threshold mismatch, timing mismatch, settlement-definition ambiguity, imperfect mapping between a binary payout and a portfolio exposure, and limited capacity all persist. The capacity constraint is concrete: with volume concentrated in a handful of series, a hedge in a thinly traded contract family is a different proposition from the same notional in a heavily traded one.
AltStreet views event contracts as tactical instruments rather than substitutes for productive core assets. Appropriate sizing depends on the hedge objective, liquidity, payoff structure and investor risk budget rather than on any general allocation rule.
Regulatory and Tax Status, Briefly
Kalshi is a CFTC-designated contract market, but the extent to which federal commodities law preempts state gambling regulation remains actively litigated, and results have diverged across jurisdictions. The Third Circuit affirmed preliminary relief for Kalshi in New Jersey in April 2026 after finding it had a reasonable chance of succeeding on its preemption theory, while a federal judge denied Kalshi's injunction request against New York and a Washington state judge granted an injunction against it. The CFTC has separately sued New York seeking a declaration of exclusive federal authority. This landscape is moving quickly; verify current status before acting.
Federal tax treatment is likewise unsettled. No IRS guidance or controlling tax decision identified by AltStreet specifically classifies Kalshi's current event contracts. Practitioners have discussed Section 1256, capital-asset and wagering-related treatments, but the interaction among Designated Contract Market status, the statutory swap exclusion and the economic characteristics of individual contracts remains unresolved. Investors should obtain tax advice rather than infer treatment from Kalshi's regulatory classification. One operational note: Kalshi exports denominate all monetary fields in cents, so aggregating a raw CSV profit-and-loss column without dividing by 100 overstates the figure by a factor of 100.
Limitations
Our series universe was selected for liquidity, which biases toward efficiently priced markets. The final calibration sample is 195 contracts across nine series, which is small. We captured top-of-book quotes only, so we cannot speak to depth or market impact. Our reference price is a mid-quote rather than a modeled fill, ignoring queue position, partial fills and adverse selection. We tested calibration, the least demanding form of efficiency; a market can be well calibrated and still beatable conditional on features we did not compute, such as final-hour momentum or cross-market inconsistency. Testing those requires dense near-close price paths that our high-frequency layer only began recording midway through the study.
Conclusion
We set out to test whether the favorite-longshot bias on Kalshi is harvestable by a systematic operator. We found no evidence that the specific mispricing we set out to test survived proper timing and liquidity controls in our sample—but our sample is small, and better-powered published work does find the bias. The honest summary is that we could not detect it, not that it is absent.
What we can state with more confidence concerns measurement rather than markets. Four apparent edges in our own data failed validation. Three came from quotes captured while contracts sat dormant after listing, including one measured 4,199 minutes before the event it priced. The fourth was our own spread statistic, which inverted when recomputed with medians. And 92.8% of our settled contracts never had a price captured at all, a coverage gap that produces silent sample selection in any analysis built on top of it.
The exchange that emerges from correct measurement is a functional one: median quoted spreads of one to three cents across every price band, fees rather than bid-ask as the dominant transaction cost, and volume concentrated in a handful of series. For allocators, accurate pricing is a feature rather than a defect—it is what makes an event contract usable for transferring exposure to a discrete outcome, and what makes the prices worth consuming as data by participants who never trade.
Practical Guidance for Researchers and Allocators
- Publish your collection funnel: Report how an archive total becomes an analyzable sample. Ours went from 15,272 settled outcomes to 195 usable contracts, and no reader could infer that from the headline figure.
- Audit the age of every reference price: Our largest false positives came from quotes captured up to 70 hours before settlement. Confirm the price existed at a moment when a position could have been opened.
- Report medians alongside means: Our own headline spread finding inverted when we switched. A small population of stale quotes will distort any average computed across a listing lifecycle.
- Measure coverage before results: Only 7% of our settled contracts had a recorded price. No error surfaces when an analysis runs on a biased subsample; you must check deliberately.
- Compute confidence intervals on every bucket: Seven of eight buckets that appeared to show an edge in our raw data were indistinguishable from chance.
- Treat fees as the binding cost: With median spreads near one cent, the fee schedule dominates, and the round-up imposes a one-cent floor per order that falls hardest on cheap contracts.
- Size to the series, not the exchange: Three series carried 81.3% of recorded volume in our archive.
- Weight larger studies above small ones, including ours: Work analyzing hundreds of thousands of contracts should carry more weight than a 195-contract null result, ours included.