
The $280,000 Hour That Changed Everything
On the morning of February 19, 2025, temperatures across Central Texas plummeted 8 degrees below the day-ahead forecast, triggering a cascade of events that would demonstrate exactly why sophisticated investors view battery energy storage systems (BESS) as the highest-volatility infrastructure play in North America. As Austinites reached for extra blankets, the Electric Reliability Council of Texas (ERCOT) confronted one of its most significant net load forecast errors—demand spiking substantially above predictions at the precise moment a planned transmission outage created an electrical bottleneck in Round Rock.
At 8:47 AM, the wholesale electricity price at a single node—a specific point on the Texas grid where a modest 9.9 megawatt battery called Rabbit Hill connects—exploded to $28,187 per megawatt-hour. For context, the average wholesale price in ERCOT typically hovers between $20-40/MWh. Industry analysis documented that during this single hour, the Rabbit Hill battery generated approximately $280,000 in gross revenue from capturing the extreme nodal locational marginal price during the transmission-constrained event—more than many comparable Texas batteries earned during the entire first half of 2025. Events like February 19 are rare, non-repeatable in timing, and impossible to forecast; returns accrue from positioning for distributions of scarcity events, not predicting exact hours.
The asset itself was unremarkable. A standard lithium-ion system, similar to thousands being deployed across the state. The location was not a major urban center—Round Rock is a suburban Austin community best known for Dell headquarters and minor league baseball. And the stress event, while significant, wasn't catastrophic—the system energy component (λ) price never exceeded $540/MWh, and the grid never approached the rolling blackouts that characterized Winter Storm Uri in 2021.
What made the difference was physics, mathematics, and market design. A planned transmission line outage created what grid operators call "irresolvable congestion"—a physical impossibility of delivering electricity from where it existed to where it was desperately needed. And the Rabbit Hill battery sat on the right side of that bottleneck, positioned to capture the full mathematical consequence of scarcity pricing in an energy-only market.
This wasn't luck. This was the structural opportunity embedded in Texas's unique electricity market—an opportunity that has attracted over $15 billion in battery storage investment since 2020 and transformed ERCOT into the most dynamic testing ground for energy infrastructure finance in the world. For investors building portfolios of real assets and tangible value strategies, understanding how a 9.9 MW battery can generate $280,000 in sixty minutes reveals the mechanics of scarcity-driven infrastructure returns that bear little resemblance to the stable cash flows of traditional utilities or real estate.
Data Note
All figures reflect publicly reported ERCOT market data, operator disclosures, and third-party energy market analysis available as of early 2025. Exact values vary by asset, node, and time period. Figures are illustrative of order-of-magnitude economics rather than precise replicable outcomes. Events like February 19 are rare, non-repeatable in timing, and impossible to forecast precisely; returns accrue from positioning for distributions of scarcity events, not predicting exact hours.
TL;DR — The ERCOT Battery Opportunity in Four Points
- What happened: A small Texas battery captured $28,187/MWh during a transmission-constrained grid stress event—demonstrating how nodal pricing and locational advantages create asymmetric returns where a 10 MW asset can outperform a 100 MW asset purely based on electrical address.
- Market evolution: ERCOT battery capacity surged from minimal levels in 2020 to over 10 GW by late 2025, saturating ancillary services and forcing the market toward energy arbitrage. Industry analysis shows top operators earning materially higher revenues than median assets—proving algorithmic optimization matters as much as hardware specifications.
- Why 4-hour wins: Regulatory requirements (NPRR 1282), multi-hour scarcity events, and the solar-driven "duck curve" favor longer-duration systems. The February 2025 event lasted five hours; 1-hour batteries had to choose which window to monetize while 4-hour systems captured the entire spike.
- Structural tailwinds: ERCOT and Texas utilities face massive large-load interconnection requests—hundreds of gigawatts in the queue—dominated by AI data centers and industrial electrification. Even partial realization of these requests would materially increase peak demand and net load volatility, creating a "volatility floor" that supports long-term arbitrage economics for well-positioned assets.
1BLUF — What ERCOT Battery Storage Teaches About Infrastructure Volatility
- The case: A $28,187/MWh price spike at a single node generated $280,000 in one hour for a 9.9 MW battery—illustrating how transmission constraints create locational pricing arbitrage disconnected from broader ERCOT-wide conditions. Events like February 19 are rare and non-forecastable; the investment case is exposure to distributions of extreme events, not prediction of individual hours.
- The mechanics: ERCOT's energy-only market design forces prices to reflect true scarcity, with nodal LMPs driven by the formula: LMP = λ (system lambda) + Congestion Component. Congestion can add substantial premiums per MWh at constrained nodes while the system energy component (λ) remains moderate.
- The broader opportunity: ERCOT faces substantial data center interconnection requests in its queue. Even partial realization would materially increase net load volatility. 4-hour BESS positioned at high-volatility nodes with advanced algorithmic bidding can capture growing arbitrage spreads driven by the structural mismatch between renewable intermittency and constant computing loads.
- Investment implication: Battery storage represents a volatility-seeking infrastructure play fundamentally different from stable-yield real assets. Returns depend on scarcity event frequency, nodal location selection, and operational sophistication—making this more akin to quantitative trading than traditional infrastructure investing.
Why Texas Became the Battery Capital: ERCOT's Unique Market Design
To understand why battery storage investment has concentrated so dramatically in Texas—over 60% of U.S. battery capacity additions in 2024 connected to ERCOT—requires understanding the state's singular approach to electricity market design. Unlike every other major power market in North America, ERCOT operates as a pure "energy-only" market with no capacity payments, no regional transmission organization overhead, and minimal federal regulatory oversight due to its isolation from interstate commerce.
The implications of this design create the structural foundation for battery economics. In capacity markets like PJM or ISO-New England, generators receive guaranteed payments simply for being available to produce electricity when called upon, creating stable baseline revenues independent of actual dispatch. ERCOT has no such mechanism. Every dollar of revenue must come from energy sales or ancillary services—markets where prices fluctuate from near-zero to thousands of dollars per megawatt-hour based purely on real-time supply and demand physics.
This creates what economists call "scarcity pricing." During periods of abundant generation—typically midday when Texas's substantial solar and wind capacity floods the grid with near-zero marginal cost electricity—wholesale prices crash toward zero or even go negative as generators pay the grid to take their excess production. During scarcity—when demand surges, renewables fade, or transmission fails—prices spike to reflect the true cost of the marginal resource needed to balance supply and demand.
The Mathematical Foundation of Grid Arbitrage
Battery storage thrives in environments with high price volatility and frequent arbitrage opportunities. The fundamental business model is elegantly simple: buy electricity when it's cheap, store it, and sell when it's expensive. The spread between purchase and sale price, minus round-trip efficiency losses (typically 85-90% for lithium-ion systems), operational costs, and degradation, determines profitability.
In ERCOT, average daily price spreads between the lowest and highest hours regularly exceed $100/MWh, with extreme days showing spreads of $1,000+/MWh. During the February 19, 2025 event, some batteries charging at 3 AM (when prices approached $0/MWh) and discharging during the morning spike captured spreads exceeding $28,000/MWh—economics that would have generated a full return on invested capital in a single day if sustainable.
AltStreet Analysis
The Battery Arbitrage Formula: Why Location Trumps Technology
The gross profit from a single charge-discharge cycle follows this formula:
Basic Arbitrage Economics
Profit = (Sell Price - Buy Price) × Capacity × η - Costs
Where η (eta) = round-trip efficiency (typically 0.85-0.90)
For the Rabbit Hill battery during the February 2025 event:
- Discharged energy: 9.9 MWh (1-hour duration at full output)
- Buy price: ~$0/MWh (charged overnight)
- Sell price: $28,187/MWh (congestion-driven spike)
- Round-trip efficiency: ~88%
- Gross profit: ($28,187 - $0) × 9.9 MWh × 0.88 = ~$245,000
- After merchant fees and operational costs: ~$240,000 net for one hour
Critical insight: This economics was only available at nodes experiencing irresolvable congestion. A battery 20 miles away at a different node might have captured only the system energy component of ~$540/MWh—generating $5,000 instead of $245,000 from the same physical hardware. Location—the specific electrical address on the grid—determined an orders-of-magnitude difference in returns.
If you remember nothing else from this section:
- Nodal location (electrical address) can matter more than any other investment variable
- The arbitrage formula is simple: (Sell - Buy) × Capacity × Efficiency - Costs
- Congestion premiums can add $20,000+ per MWh at constrained nodes vs. system energy component (λ)
From Capacity Payments to Scarcity Rents
The absence of capacity payments fundamentally changes investment risk profiles. In PJM, a battery might lock in $50,000-100,000 per MW annually from capacity auctions, providing guaranteed baseline revenue regardless of market volatility. This stability attracts conservative institutional capital seeking predictable cash flows similar to infrastructure debt or real estate NOI.
ERCOT offers no such safety net. The entire revenue stream depends on capturing market spreads—either through ancillary services (payments for standing ready to balance the grid) or energy arbitrage (buying low, selling high). This makes ERCOT batteries fundamentally different financial instruments than traditional infrastructure. They are volatility-seeking assets that profit from grid stress rather than stability-seeking assets that generate consistent yields.
The investment thesis rests on a paradox: as more batteries enter the market, they reduce the frequency of extreme price spikes by providing the flexible capacity the grid needs. This commoditizes the ancillary services market—exactly what happened between 2023 and 2025 as revenues per megawatt compressed significantly. But simultaneously, growing demand from AI data centers and industrial electrification creates new scarcity events at the system and nodal level, maintaining the "volatility floor" that justifies continued investment.
Asset Class Comparison
ERCOT Batteries Behave Like Deep Out-of-the-Money Options, Not Toll Roads
For investors accustomed to traditional infrastructure, ERCOT merchant batteries require a fundamental mental model shift. Consider the comparison:
| Characteristic | Traditional Infrastructure (Toll Road, Pipeline) | ERCOT Merchant Battery |
|---|---|---|
| Revenue profile | Predictable, contracted, low volatility | Lumpy, event-driven, extreme volatility |
| Value driver | Stable utilization and throughput | Capturing tail-event scarcity pricing |
| Comparable financial instrument | Bond-like: consistent coupon payments | Option-like: low base value, high convexity |
| Risk-return relationship | Linear: more traffic = more revenue | Non-linear: extreme events drive total returns |
| Investor appeal | Core infrastructure allocations | Opportunistic/volatility-seeking allocations |
Key insight: A 4-hour ERCOT battery behaves more like a deep out-of-the-money option on grid stress than a toll road or pipeline. Unlike pure options, batteries generate modest base revenue from ancillary services and routine arbitrage—providing a floor that covers operations and debt service in normal years. But during the 5-10 extreme events per year when the grid experiences stress—forecast errors, transmission failures, weather extremes—the battery captures asymmetric value that can exceed months of normal operations. This optionality drives the investment thesis, not the stable base case. Investors seeking 8% coupon-like stability should avoid merchant batteries; those comfortable with volatility in exchange for mid-teens IRRs from convexity should study nodal pricing.
The Revenue Stack: How Batteries Actually Make Money in Texas
Unlike traditional power generation that earns revenue primarily through selling electricity, ERCOT batteries optimize across multiple simultaneous revenue streams in a practice called "revenue stacking." Understanding how these streams interact—and how their relative importance has shifted dramatically from 2023 to 2025—is essential for evaluating current investment opportunities in the sector.
Ancillary Services: The Foundation That's Eroding
Ancillary services represent payments from ERCOT for standing ready to provide specific grid reliability functions. These markets were the original driver of the Texas battery boom because they offered the closest equivalent to "capacity payments" available in the energy-only market design. The primary ancillary service products include Regulation Up/Down (automatic frequency response), Responsive Reserve Service (primary frequency response deploying within 10 seconds), ERCOT Contingency Reserve Service (secondary reserves deploying within 10-30 minutes), and Non-Spin Reserve (offline capacity available within 30 minutes).
In 2023, during the early deployment phase of Texas batteries, ancillary services accounted for the overwhelming majority of total battery revenue, with top-performing assets earning substantial returns annually. The market was severely undersupplied—ERCOT needed frequency regulation and reserves, and only a handful of batteries existed to provide them. This created extraordinary pricing power as batteries could essentially name their price for reliability services.
The collapse came swiftly. As battery capacity exploded from minimal levels at the end of 2023 to over 10 GW by late 2025, the ancillary services market saturated. Average AS revenues per megawatt fell dramatically in just 24 months. By mid-2025, ancillary services represented approximately half of the revenue stack, with energy arbitrage taking over as the primary income source.
| Metric | Early Cycle (2020-2021) | Peak (2023) | Mature (2025) |
|---|---|---|---|
| Operational BESS Capacity | Minimal (~200 MW) | ~3,400 MW | 10,000+ MW |
| Revenue Environment | Limited data | Peak revenues | Compressed revenues |
| Ancillary Service Share | Majority | ~84% | ~48% |
| Energy Arbitrage Share | Modest | ~16% | ~52% |
| Peak ERCOT Demand | ~74,000 MW | ~85,500 MW | 86,000+ MW |
| Projected Data Center Load by 2035 | Minimal | Emerging (~5 GW) | Substantial (up to ~35 GW) |
Energy Arbitrage: The New Frontier
As ancillary services commoditized, the market's center of gravity shifted toward energy arbitrage—the practice of capturing intraday price spreads by charging when electricity is cheap and discharging when it's expensive. This transition fundamentally changed the skill set required for successful battery operation.
Ancillary services are relatively straightforward to optimize. ERCOT publishes day-ahead clearing prices for each service, allowing operators to determine which markets offer the best risk-adjusted returns. State of charge management is manageable—maintain the required reserves, deploy when called, collect the clearing price. The barrier to entry is modest, which explains why the market saturated quickly once batteries arrived at scale.
Energy arbitrage is exponentially more complex. Real-time electricity prices (LMPs) change every five minutes at every node on the grid. Optimal bidding requires forecasting these prices multiple dispatch intervals in advance, balancing the risk of discharging now versus preserving state of charge for a potential higher-price interval later.
The result is a market where operational sophistication creates dramatic performance divergence. Industry analysis of H1 2025 performance shows top-quartile ERCOT batteries earning materially higher revenues per kW-month than median assets—a difference attributable primarily to algorithmic optimization quality rather than physical asset characteristics.
AltStreet Analysis
The Algorithmic Advantage: Why Software Matters More Than Hardware
The substantial revenue spread between top and median ERCOT batteries in 2025 reveals that operational excellence—not physical specifications—determines investment returns. Two identical 100 MW / 400 MWh lithium-ion systems at adjacent nodes can produce vastly different cash flows based purely on bidding algorithms and dispatch strategy.
Advanced optimization platforms like Ascend Analytics' SmartBidder or GridBeyond's AI-powered systems provide three critical capabilities:
- Predictive analytics: Machine learning models trained on years of ERCOT price data can materially outperform simple historical averages in forecasting five-minute nodal LMPs, enabling batteries to position ahead of price spikes rather than reacting after they occur.
- Risk-adjusted bidding: Rather than simply discharging during the highest-price interval, sophisticated algorithms calculate the expected value of preserving state of charge for statistically probable future opportunities. During recent heatwaves, optimized batteries avoided discharging during moderate afternoon prices, preserving capacity for evening peaks that reached much higher levels.
- RTC+B co-optimization: The December 2025 market redesign requires simultaneous optimization across energy and ancillary services every five minutes. Manual operators cannot process the decision complexity; algorithmic systems can evaluate thousands of potential bid combinations and select the expected value-maximizing strategy in real-time.
Investment insight: When evaluating ERCOT battery opportunities, assess operator sophistication as rigorously as equipment specifications. A $50 million investment with a top-tier algorithmic optimizer may generate better risk-adjusted returns than a $100 million investment with mediocre manual dispatch. The software layer is where alpha is created or destroyed.
If you remember nothing else from this section:
- Revenue has shifted from ancillary services dominance (early 2020s) to energy arbitrage representing approximately half of revenues (2025)
- Top operators earn materially higher revenues than median through algorithmic optimization, not better hardware
- The RTC+B market redesign (Dec 2025) makes software sophistication mandatory, not optional
The February 2025 Event: Anatomy of a $28,187/MWh Price Spike
The morning of February 19, 2025 provides the definitive case study in how ERCOT's nodal pricing mechanics can create extreme value concentration at specific grid locations during stressed conditions. Understanding this event in detail reveals both the opportunities and risks embedded in merchant battery storage investments.
The Setup: Forecast Errors and Transmission Constraints
The event began with compounding forecast failures. National Weather Service temperature forecasts for Central Texas predicted overnight lows in the mid-30s Fahrenheit. Actual temperatures across the Austin metro area bottomed out in the mid-20s—an 8-12 degree miss that translated directly to unexpected heating load.
This magnitude of forecast error is unusual but not unprecedented. What made February 19 exceptional was timing and geographic concentration. The cold snap coincided with the morning load pickup as commercial and industrial facilities powered up for the day, creating a demand surge precisely when forecast errors have maximum impact. And the unexpectedly cold temperatures concentrated in the Austin-Round Rock corridor rather than distributing evenly across ERCOT's service territory.
Simultaneously, a planned transmission outage on the Sewaju-Leander 138kV line restricted power flow into the Round Rock area. Under normal conditions, this outage would be manageable—ERCOT maintains transmission redundancy allowing power to route around planned maintenance. But with demand spiking substantially above forecast across the system and concentrated in precisely the region where transmission capacity was reduced, the grid faced what operators call "irresolvable congestion."
Nodal Pricing Theory Meets Reality
This is where ERCOT's locational marginal pricing (LMP) methodology demonstrates its mathematical elegance and practical brutality. Every five-minute interval, ERCOT's market software solves a massive optimization problem: which generators should run, how much should each produce, and at what price should they be compensated—all subject to the physical constraints of the transmission network.
The resulting price at each node reflects three components mathematically:
Locational Marginal Price Formula
LMP = λ + Congestion + Losses
Where: λ (lambda) = ERCOT-wide marginal cost of energy
Congestion = cost of transmission constraints
Losses = marginal cost of line losses to deliver power
Under normal conditions, congestion and losses are minimal—perhaps $5-10/MWh combined. The LMP at most nodes approximately equals lambda, the ERCOT-wide energy price. During the February 19 event, lambda peaked around $540/MWh—high but not extraordinary for a cold weather emergency. But at nodes experiencing irresolvable congestion like the Rabbit Hill interconnection point, the congestion component exploded.
When ERCOT's optimization algorithm determines that no physically feasible dispatch can fully relieve congestion at a node, the congestion price mathematically approaches the value of lost load—effectively asking "what would a customer pay to avoid being curtailed?" The answer, encoded in ERCOT's Value of Lost Load (VOLL) parameters, is very high. While offer caps constrain energy offers, nodal LMPs can still spike above ERCOT-wide caps when congestion and scarcity pricing mechanics bind locally.
The result: during the peak stress interval from 8:30-9:30 AM on February 19, the Rabbit Hill node experienced locational marginal prices averaging $28,187/MWh—composed of approximately $540/MWh system energy component (lambda) plus over $27,000/MWh congestion premium. Assets at this specific electrical address could capture this full nodal LMP. Assets just 10-20 miles away at different nodes without congestion constraints captured only the system energy component pricing.
| Metric | Rabbit Hill Node (Congested) | System Energy Component (λ) |
|---|---|---|
| Peak Interval LMP | $28,187/MWh | ~$540/MWh |
| High-Price Window Duration | ~4.5 hours (5:30 AM - 10:05 AM) | ~1.5 hours (8:00 AM - 9:30 AM) |
| Cumulative Congestion Component | $26,500+ per MWh | Negligible |
| Battery Asset | Rabbit Hill BESS (9.9 MW / 9.9 MWh) | N/A |
| Estimated Revenue (Single Hour) | ~$245,000 gross | ~$5,000 (at system price) |
The Duration Disadvantage: Why 1-Hour Systems Left Money on the Table
One of the most instructive aspects of the February 2025 event was its duration. Unlike many price spikes that last 15-30 minutes before the grid rebalances, the Round Rock congestion persisted from approximately 5:30 AM through 10:05 AM—roughly 4.5 hours of sustained elevated pricing, with the peak hour averaging $28,187/MWh and adjacent hours ranging from several thousand to over $10,000/MWh.
For the Rabbit Hill battery with its 1-hour duration (9.9 MW / 9.9 MWh), this created an optimization problem. The system could discharge at full power for exactly one hour. Operators faced a choice: discharge during the single highest-price hour (8:30-9:30 AM) and capture ~$245,000, or spread discharge across multiple hours to capture more total volume but at lower average prices.
The mathematical optimal strategy was clear—discharge during the peak hour. But this meant leaving substantial value on the table during the 3.5 hours of exceptional pricing surrounding the peak. A hypothetical 4-hour system at the same node could have captured value throughout the entire event window rather than choosing a single hour.
If you remember nothing else from this section:
- Location (nodal address) determined a several-thousand-percent revenue difference between identical batteries
- The event lasted 4.5 hours—1-hour batteries monetized 1 hour; 4-hour batteries captured the full window
- Congestion components can add $20,000+ per MWh at constrained nodes vs. system energy component (λ)
The Shift to 4-Hour Systems: Regulatory, Economic, and Physical Drivers
The battery storage industry is experiencing a pronounced shift toward 4-hour duration systems across all major markets, but the trend is particularly pronounced in ERCOT where three distinct forces are converging: regulatory requirements tightening state of charge obligations, the solar-driven "duck curve" creating multi-hour arbitrage windows, and extreme weather events demonstrating that scarcity pricing can persist for 4-6 hours rather than the 1-2 hour windows that characterized earlier grid stress.
Regulatory Tailwinds: NPRR 1282 and the SOC Mandate
ERCOT's relationship with battery state of charge (SOC) management has evolved from permissive to prescriptive as regulators learned hard lessons from batteries that bid services they couldn't actually deliver. Nodal Protocol Revision Request (NPRR) 1282, currently under consideration, would require batteries bidding into the Non-Spin ancillary service market to maintain a 4-hour state of charge relative to their offered capacity. For a 100 MW battery, this means maintaining at least 400 MWh of stored energy to bid the full 100 MW into Non-Spin—effectively de-rating 1-hour and 2-hour systems that physically cannot meet this threshold.
The December 5, 2025 launch of Real-Time Co-optimization plus Batteries (RTC+B) further tightened SOC enforcement. Under the previous market design, batteries could simultaneously participate in energy and ancillary services through separate resources. RTC+B eliminates this loophole by requiring a single integrated bid that co-optimizes energy and AS participation while maintaining strict SOC accounting every five minutes.
AltStreet Analysis
How Duration Affects Market Access Under New Rules
The tightening SOC requirements create a tiered market access structure based on battery duration:
| Duration | AS Market Access | Energy Arbitrage Capability | Regulatory Risk |
|---|---|---|---|
| 1-Hour System | Regulation (full), ECRS (full), Non-Spin (25% de-rated) | Limited to short spikes; must choose single hour | High - likely further restrictions |
| 2-Hour System | Regulation (full), ECRS (full), Non-Spin (50% capacity) | Moderate - can capture extended spikes | Moderate - meets current minimums |
| 4-Hour System | Full access to all AS products at rated capacity | High - sustained discharge through multi-hour events | Low - exceeds all proposed requirements |
Investment implication: While 1-hour systems have lower capital costs ($300-400/kWh installed vs. $400-500/kWh for 4-hour), the regulatory de-rating and limited arbitrage windows reduce their effective earning capacity. On a $/kW basis accounting for reduced market access, 4-hour systems offer superior economics despite higher upfront investment.
The Duck Curve: Solar's Gift to Battery Economics
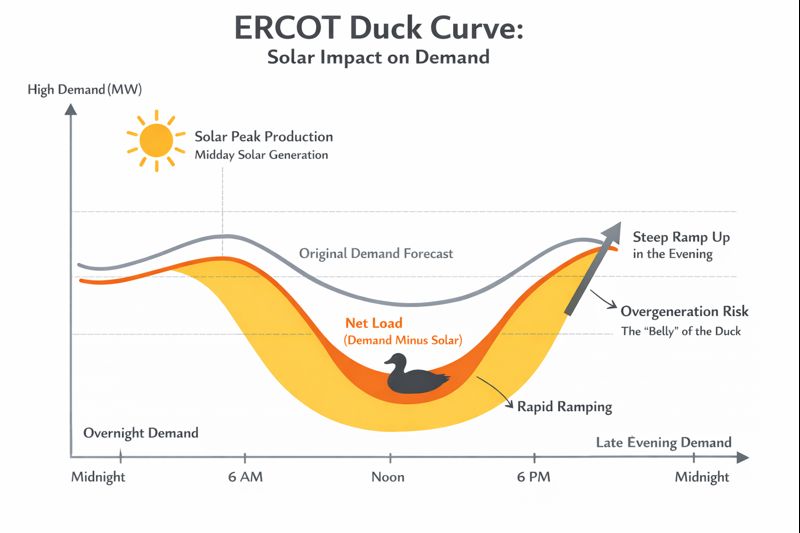
Texas's explosive solar growth—from negligible capacity in 2015 to over 25 GW installed by late 2025—has fundamentally reshaped the daily load profile in ways that naturally favor battery storage. The phenomenon called the duck curve creates a nearly perfect daily arbitrage cycle. Batteries charge during the midday solar surplus at $0-20/MWh, then discharge during the evening ramp at $100-500/MWh during normal conditions or much higher during stressed conditions.
The critical insight: this arbitrage window is expanding in duration. In 2020, the evening ramp lasted perhaps 1-2 hours. By 2025, with ~25 GW of solar creating deeper midday suppression and steeper evening transitions, the high-price ramp commonly lasts 3-4 hours. A 1-hour battery must pick the single best hour within this window. A 4-hour battery can discharge steadily throughout the entire ramp, capturing the full area under the price curve rather than just the peak.
The AI Data Center Catalyst: Up to ~35 GW of Structural Demand Growth
While battery market dynamics have been dominated by supply-side growth (capacity additions) since 2020, the demand side of the equation is preparing to reassert itself in dramatic fashion. ERCOT's 2024 Long-Term System Assessment projects that large-scale data centers—primarily driven by artificial intelligence computing infrastructure—could add up to ~35 GW of new peak demand by 2035. ERCOT's long-term assessments include large-load interconnection requests dominated by data centers, though only a portion will ultimately materialize.
To contextualize this figure: ERCOT's current all-time peak demand record is 85.5 GW. The up to ~35 GW data center projection represents a 41% increase in peak load over the next decade from a single load category. This dwarfs any historical demand growth driver in the grid's history.
Unlike traditional industrial loads that may operate 8-16 hours per day or reduce consumption during peak pricing, data centers represent "firm" load—they require 24/7 uninterrupted power at constant levels. AI training workloads in particular cannot tolerate interruptions. This creates a profound challenge for a grid increasingly dominated by intermittent renewables.
The up to ~35 GW of AI load doesn't just add to peak demand—it amplifies the volatility of the net load curve, creating steeper ramps and more frequent scarcity conditions. This leads to what analysts call the "volatility floor" thesis: while growing battery capacity will continue to commoditize certain revenue streams, the underlying driver of grid stress (mismatch between intermittent renewables and constant loads) is intensifying rather than moderating.
Federal Tax Incentives: The Hidden 30-50% Subsidy
No discussion of battery storage economics is complete without understanding the profound impact of federal tax policy. The Investment Tax Credit (ITC) provisions in the Inflation Reduction Act transformed standalone battery storage from a tax-disadvantaged asset class to one of the most tax-advantaged infrastructure investments available to U.S. investors.
Standalone battery energy storage systems now qualify for a 30% tax credit based on the full capital cost of the project. For a typical $50 million 100 MW / 400 MWh project, the baseline ITC provides $15 million in tax benefits. This credit can be taken in the year the project is placed in service, creating immediate value.
The IRA's innovation was creating a series of "bonus credits" or "adders" that reward specific policy objectives. A battery project meeting multiple criteria can stack these adders to achieve total tax benefits approaching 50% of capital costs:
| Adder Category | Bonus Credit | Requirements |
|---|---|---|
| Base ITC | 30% | Standalone battery storage system |
| Domestic Content Bonus | +10% | Steel/iron manufactured in U.S.; manufactured components meet domestic content thresholds |
| Energy Community Bonus | +10% | Located in brownfield site, or census tract with historical fossil fuel employment or closed coal plants/mines |
| Low-Income Community Bonus | +10-20% | Located in designated low-income community or tribal land (competitive allocation, limited availability) |
Beyond the ITC, battery storage qualifies for 5-year Modified Accelerated Cost Recovery System (MACRS) depreciation. When combined with the ITC, the total tax benefits can reach 44-47% of total capital cost. This tax treatment dramatically improves project IRRs and enables aggressive debt financing. Many battery projects are financed with 60-70% debt, with the tax benefits flowing to equity investors who contribute only 30-40% of capital but capture 100% of the tax credits.
Evaluating ERCOT Battery Investments: The Due Diligence Framework
For investors building exposure to real asset portfolios, ERCOT battery storage represents a fundamentally different risk-return profile than traditional infrastructure. Rather than stable cash flows from regulated utilities or contracted renewables, batteries offer volatility-seeking exposure where returns depend on capturing scarcity events, managing algorithmic bidding, and positioning at high-value grid nodes.
AltStreet Analysis
The Investor Type Framework: Who Should (and Shouldn't) Own ERCOT Batteries
Battery storage's volatility-seeking risk profile suits specific investor types while creating material mismatches for others:
✓ Well-Suited Investors
- Infrastructure opportunistic funds: Seeking 15-20% IRRs with 7-10 year holds, comfortable with merchant exposure and operational complexity.
- Energy-focused private equity: Existing operational expertise in power markets and optimization. Can internalize asset management rather than relying on third-party operators.
- HNW/family offices with energy expertise: Accredited investors who understand power markets and can evaluate operational capability. Often invest alongside institutional capital in $5-25M equity checks.
- Real asset allocators seeking diversification: Battery volatility provides uncorrelated exposure within infrastructure portfolios dominated by stable-yield assets.
✗ Poor Fit Investors
- Core infrastructure funds: Mandates requiring stable cash yields (6-8% annual distributions) cannot accommodate 80%+ revenue volatility seen from 2023 to 2025.
- Retail investors without power market knowledge: Cannot evaluate operational quality, nodal location analysis, or distinguish quality assets from poor positioning.
- Income-focused strategies: Merchant batteries cannot provide predictable quarterly distributions required by income mandates during low-revenue periods.
- Short-term capital: 1-3 year hold periods insufficient to weather revenue cycles and benefit from structural demand growth.
Key Takeaways: What the February 2025 Event Teaches About Infrastructure Volatility
The Rabbit Hill battery's $280,000 hour provides a comprehensive education in grid economics, market design, and the fundamental differences between volatility-seeking and stability-seeking infrastructure investments. Several lessons emerge with broad applicability:
Lesson 1
Location Determines Returns More Than Technology
A 10 MW battery at the Rabbit Hill node captured several-thousand-percent higher revenue during the peak interval than an identical system 20 miles away. Nodal price analysis and transmission congestion patterns matter exponentially more than battery chemistry, inverter specifications, or efficiency metrics. Due diligence must prioritize grid topology over equipment catalogs.
Lesson 2
Operational Sophistication Creates Over 100% Performance Spread in Recent Analyses
Top-quartile operators earned $4.63/kW-month while median assets captured $2.13/kW-month in H1 2025. This divergence represents an over 100% performance spread in recent analyses and reflects algorithmic optimization quality, not physical asset differences. The software layer—bidding platforms, machine learning models, real-time dispatch—is where alpha is created or destroyed in merchant battery markets.
Lesson 3
Duration Matters More as Events Extend to 4-6 Hours
The February 2025 event lasted 4.5 hours of elevated pricing. A 1-hour battery captured one peak hour; a 4-hour system monetized the entire window. As extreme weather intensifies and solar penetration deepens the duck curve, multi-hour discharge capability becomes the primary driver of total revenue capture rather than peak power capacity.
Lesson 4
Market Saturation Drives Revenue Mix Evolution
Ancillary services collapsed from 84% to 48% of revenue as battery capacity grew 5x from 2023 to 2025. The market shifted from passive capacity payments to active energy arbitrage requiring continuous optimization. Future battery investments must assume energy arbitrage dominance and build operational capability accordingly.
Lesson 5
Data Center Demand Creates Structural Volatility Floor
While additional battery capacity commoditizes markets, the up to ~35 GW of AI data center load arriving by 2035 creates offsetting scarcity. The structural mismatch between 24/7 computing loads and intermittent renewables ensures persistent arbitrage opportunities for well-positioned assets, preventing complete revenue collapse despite massive supply growth.
Most Important
Federal Tax Credits Transform Project Economics
The 30-50% ITC combined with 5-year MACRS depreciation reduces effective capital costs by 44-47%, enabling mid-teens IRRs even at compressed merchant revenues. Tax policy is not a "nice to have" benefit—it's the fundamental enabler making battery storage economically viable at scale. Projects must be structured to maximize tax credit capture and deploy tax equity efficiently.
Conclusion: ERCOT Batteries as Volatility Infrastructure
The Rabbit Hill battery's $280,000 hour will be studied in energy finance courses for years as the definitive case study in how market design, transmission physics, and locational advantages combine to create infrastructure returns that resemble options trading more than traditional utilities. But the lesson extends beyond a single anomalous event.
ERCOT battery storage represents a new category of real asset investment: volatility infrastructure. Unlike traditional infrastructure that generates stable cash flows from predictable demand (toll roads, regulated utilities, cell towers), batteries profit from market dislocations, scarcity events, and the mathematical consequences of physics meeting market design. Returns are lumpy, concentrated in tail events, and dependent on capturing brief windows when the grid cannot function without flexible capacity.
This creates a paradox that defines the asset class. As more batteries deploy, they reduce the frequency of extreme volatility by providing the very flexibility the grid needs. Yet simultaneously, structural demand growth from data centers and deepening renewable penetration create new sources of volatility at the system and nodal level. The result is a market that won't return to the $196,000/MW annual revenues of 2023, but equally won't collapse to zero as long as the fundamental physics of intermittent generation meeting constant loads persists.
AltStreet's view: For portfolios built around real assets and tangible value strategies, battery storage provides uncorrelated exposure to traditional infrastructure. It's a hedge against grid stress rather than grid stability. The optimal allocation is 5-15% of an energy infrastructure sleeve for investors who can evaluate nodal economics, assess operator quality, and tolerate 50-80% revenue volatility year-over-year. Investors seeking stable 8% yields from predictable cash flows should look elsewhere. Those seeking 15-20% IRRs from asymmetric exposure to scarcity events should study ERCOT's transmission maps and start building expertise in locational marginal pricing.
The $280,000 hour wasn't luck. It was mathematics, physics, and market design creating exactly the outcome the system intended: compensating flexible assets at the true value of their contribution during scarcity. There will be more $280,000 hours as data centers arrive, renewables proliferate, and extreme weather intensifies. The question for investors is whether they'll be positioned at the right nodes with the right duration and the right operational sophistication to capture them.
Master Energy Infrastructure and Real Asset Investing
Explore comprehensive guides to battery storage, renewable energy, and tangible value strategies that provide uncorrelated exposure to traditional markets.
Energy Infrastructure
Battery storage, renewable projects, and grid modernization investment opportunities
Real Assets Overview
Comprehensive framework for tangible value investing across infrastructure, resources, and hard assets
Portfolio Construction
Integrate volatility infrastructure with stable-yield real assets for optimal risk-adjusted returns