AltStreet Terminal · 2026
An alternative investment data terminal
that reads the filing, the offering documents and the pitch.
AltStreet Terminal is an evidence layer for private markets. It reads SEC filings, offering documents and platform marketing against each other, then turns them into comparable platform data, deal flow, market trends and evidence-linked diligence. The filing alone is not enough, the offering document alone is not enough, and the platform's own site is not trustworthy enough. The terminal connects them on one normalized schema, so an art platform and a real estate platform, a farmland note and a private credit fund, can be read on the same rows and compared. One subscription opens all of it. Nothing here is a ranking.
Latest print 2026-10-18 · Alt Markets Health Index 54.0 for 2026-09
387
Platforms monitored
109 reviewed and compared · 344 EDGAR-verified
11K
Offerings tracked
4,233 from platform sites · 6,919 from filings
1,886
Offering documents
reviewed and cited by page
70K
Cited excerpts
1132 discrepancies · 232 deals · 46 platforms
710K
SEC filings tracked
Form C, D and Reg A, market-wide
63
Market series
19 market categories · 497 verified exits
The record behind the terminal · live counts, refreshed hourly
370K
Offering timelines
one per offering chain, Form D, Reg CF and Reg A, with status and velocity
281K
Filing events
typed and graded: first sales, raises, stalls, auditor changes, bankruptcies
363K
Resolved entities
firms, people and 4,718 broker-dealers, one id each across every filing
34K
Enforcement actions
SEC litigation and administrative proceedings, FINRA disciplinary actions, joined to the graph
24K
Advisers and funds
Form ADV rosters · 47K private funds with auditors, custodians and administrators
649K
LEI records
31K linked to issuers, advisers and entities · 2,083 Reg CF valuations read from memoranda
Three sources
The filing, the document, and the pitch
Every Form C, Form D and Regulation A filing market-wide, enumerated by filing date, with the issuer's own numbers and the filing history behind each entity. What was disclosed, when, and whether it kept being disclosed.
710K filings
Private placement memoranda, offering circulars, fact sheets and investor reports collected, extracted and reviewed, with every finding cited to a page. Fee waterfalls, related-party terms, valuation methods and the risk factors that matter, read from the document rather than the summary.
1,886 documents · 70,289 cited excerpts
What each platform says on its own site, captured and dated: target returns, track records, fees and liquidity claims. Read against the filing and the document, so a discrepancy is a finding with a citation, not an opinion. 387 platforms are monitored; 109 are reviewed in full and sit in the comparison.
1,186 captures · 1132 discrepancies flagged
One product
Two surfaces, one subscription
Which platforms to use, on verified rows: fees as charged, liquidity as delivered, governance as disclosed, and the deal-level returns behind the marketing, each claim clickable through to the filing or offering-document excerpt it rests on. The public view shows three platforms; Pro shows every platform at depth.
OpenWhat the markets are doing, on three layers: capital formation from EDGAR, prices from public benchmarks and AltStreet-derived indexes, outcomes from verified exits and filed fees. New offerings the day they appear, on the platform or in the filing, plus alerts, saved charts and the health index.
OpenThe market dashboard's 19 categories: Regulation Crowdfunding · Regulation A · Real Estate · On-Chain Credit · Tokenized Treasuries & RWA · Tokenized Equities · Private Credit · Farmland · Pre-IPO Secondaries · Private Funds (PE, VC, Hedge) · Music Royalties · Carbon · AI Infrastructure & GPU · Litigation Finance · Collectibles · Wine & Spirits · Art · Energy & Mineral Rights · Prediction Markets. The research hub's asset-class pages map onto these; the dashboard frame is the one the series are collected on.
Evidence, claim by claim Investor
Every number links to the page it came from.
Behind the comparison rows and the deal reviews sits an evidence layer: verbatim excerpts from the offering documents or the filing, with the page reference, the metric it supports, and a discrepancy flag when the marketing, the document and the filing do not agree. A target return on a platform's site is checked against the projection in the offering documents and the filing's disclosed history. That is the compliance read an adviser or a diligence desk would do by hand, done in advance and cited.
- Verbatim quotes with page references, not paraphrase
- Marketing claims checked against the offering documents and the filing
- Discrepancies flagged and explained per deal and per platform
- Human-verified excerpts marked as such
Platform comparison Pro
Every platform on the same primitives.
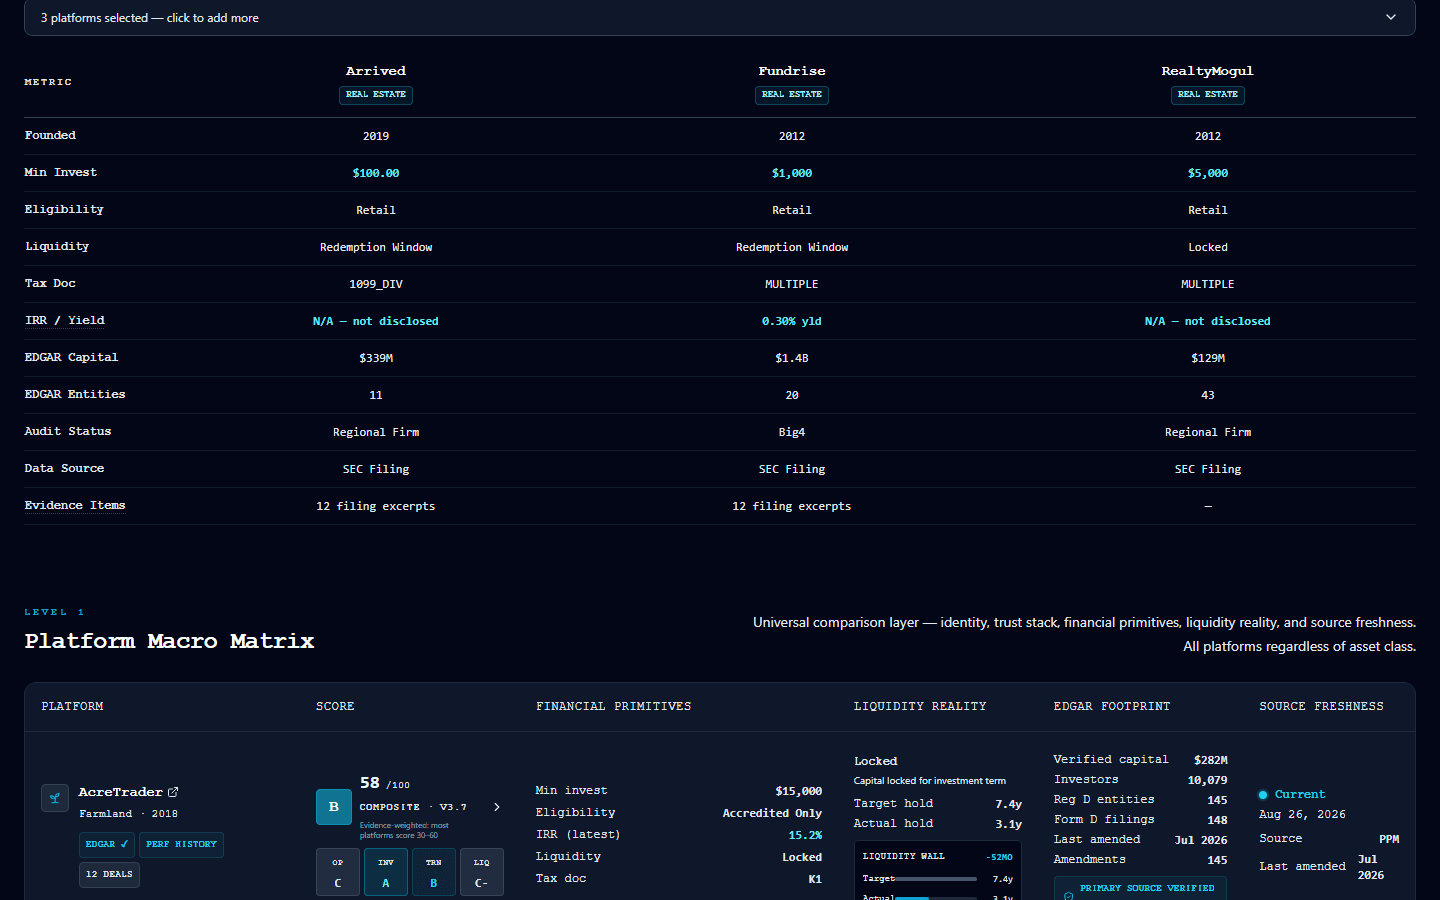
Alternative-investment platforms compared on normalized, filing-verified rows, whatever the asset: fee forensics, liquidity reality, going-concern language, NAV methodology, trust and reporting quality. Because the schema is shared, Masterworks sits beside Fundrise and AcreTrader beside a litigation funder, and the question of where a dollar is treated best can be asked across categories rather than within one. The public view carries the headline rows for three platforms. Pro opens every reviewed platform and the deal-level data beneath: returns by deal, IRR history against what was disclosed, and the evidence behind each row.
- Every platform with a full AltStreet review, on identical rows
- Fee drag as filed: acquisition, management, disposition, carry
- IRR track error: how often disclosed returns diverged from exits
- Going-concern and NAV-methodology rows from the filings
Deal flow Pro
Every new offering, the day it appears.
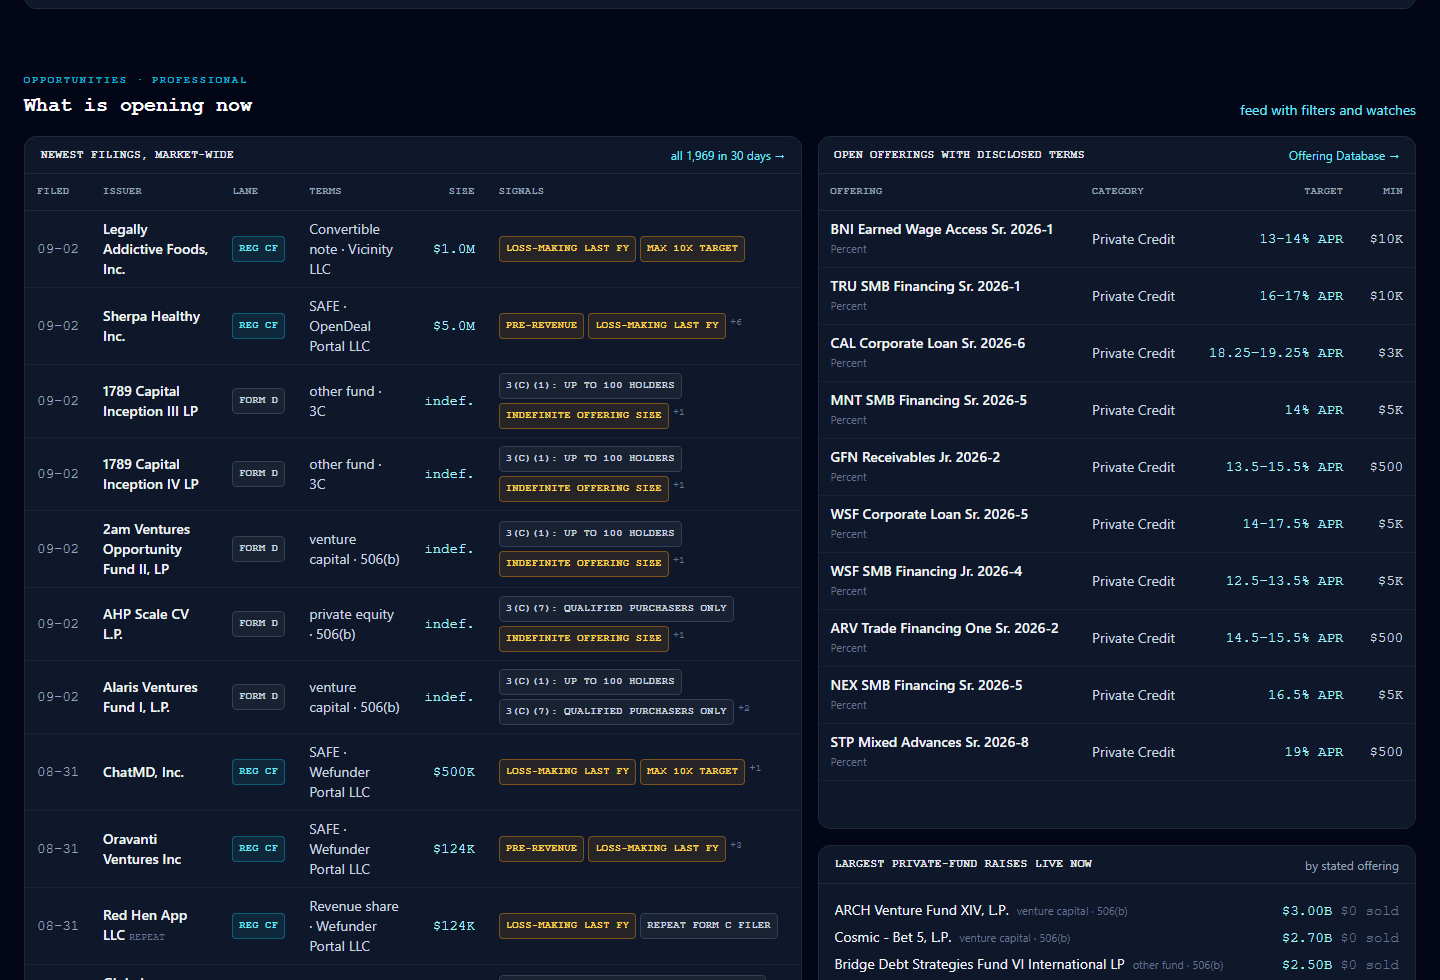
Offerings surface in two channels, and which comes first depends on the exemption. A Reg CF offering or a Reg A statement must reach EDGAR before it can be marketed, so the filing feed sees it before the platform does. A private placement on a Reg D marketplace, a farm on AcreTrader or a solar portfolio on Energea, appears on the platform first and files its Form D within fifteen days of the first sale. The terminal watches both channels and joins them: the listing with its stated terms, the filing with the issuer's own numbers, target and maximum, instrument, revenue and net income, fund type, exemption and investor count. Descriptive signals sit beside each row. Nothing is ranked and nothing is recommended.
- EDGAR first for Reg CF and Reg A; the platform first for Reg D marketplaces
- Listing and filing joined into one record with disclosed terms
- Issuer filing trails and repeat-filer context
- Daily email watches on any saved filter
Capital formation Pro
How much capital is forming, and how fast.
Monthly series enumerated from the filings themselves: new Reg CF offerings and the capital they seek, portal share and concentration, Reg A statements by tier and issuer family, private-fund launches by fund type and exemption. Then the questions the filings answer over time: what share of a cohort reaches a progress update, how many issuers keep filing annual reports, and how the ones that do are doing.
- Every print carries its breakdown: largest raises, security types, intermediaries
- Cohort completion, compliance by vintage, issuer health from Form C-AR
- Portal-level progress-update rates
- AltStreet's own enumeration of EDGAR, never official SEC totals
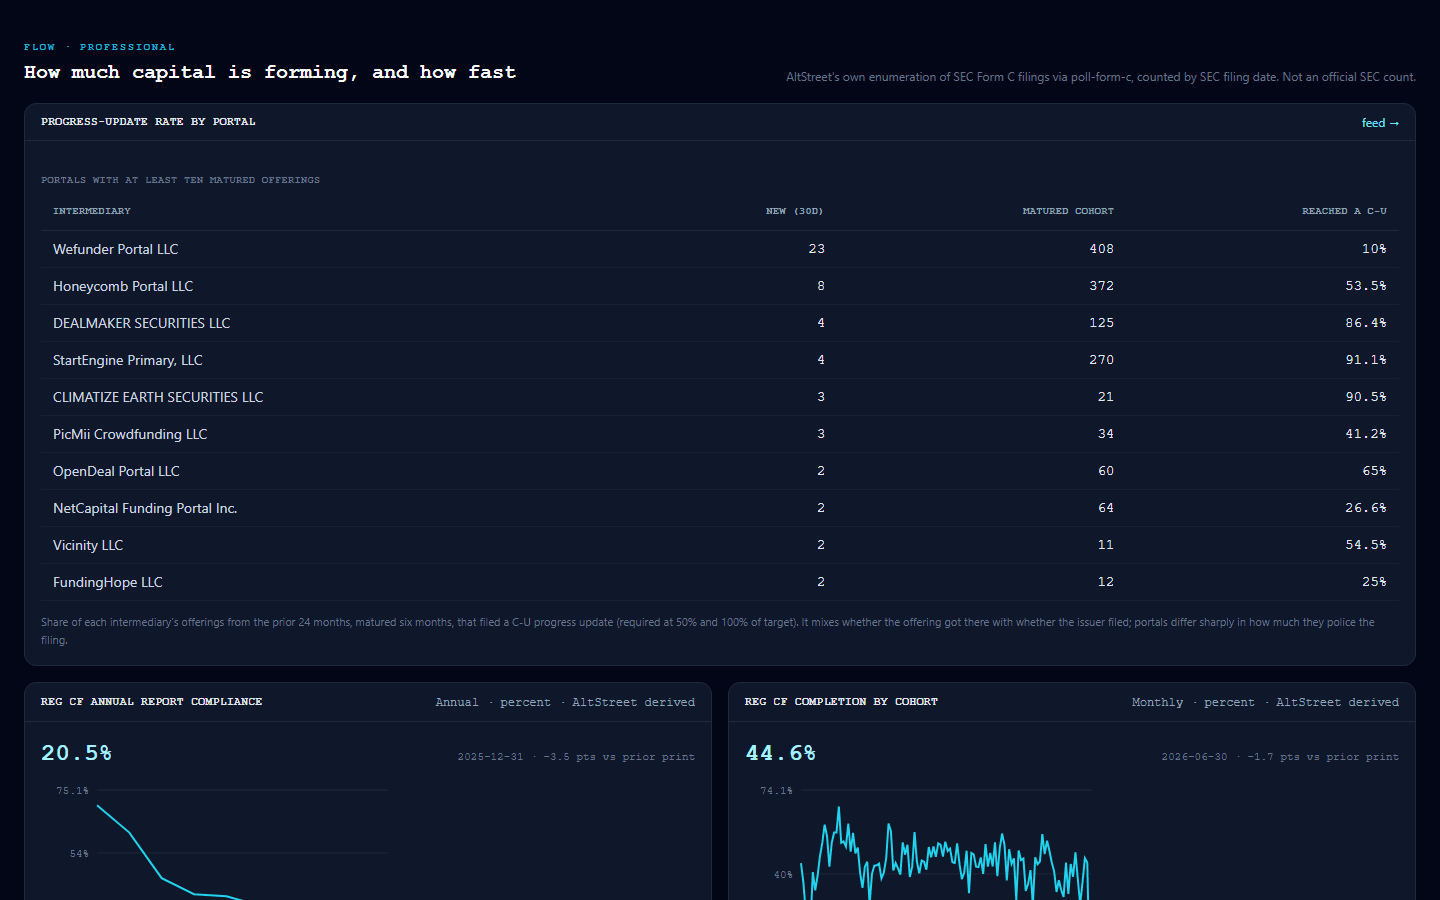
Chart workbench Free
Overlay anything against anything.
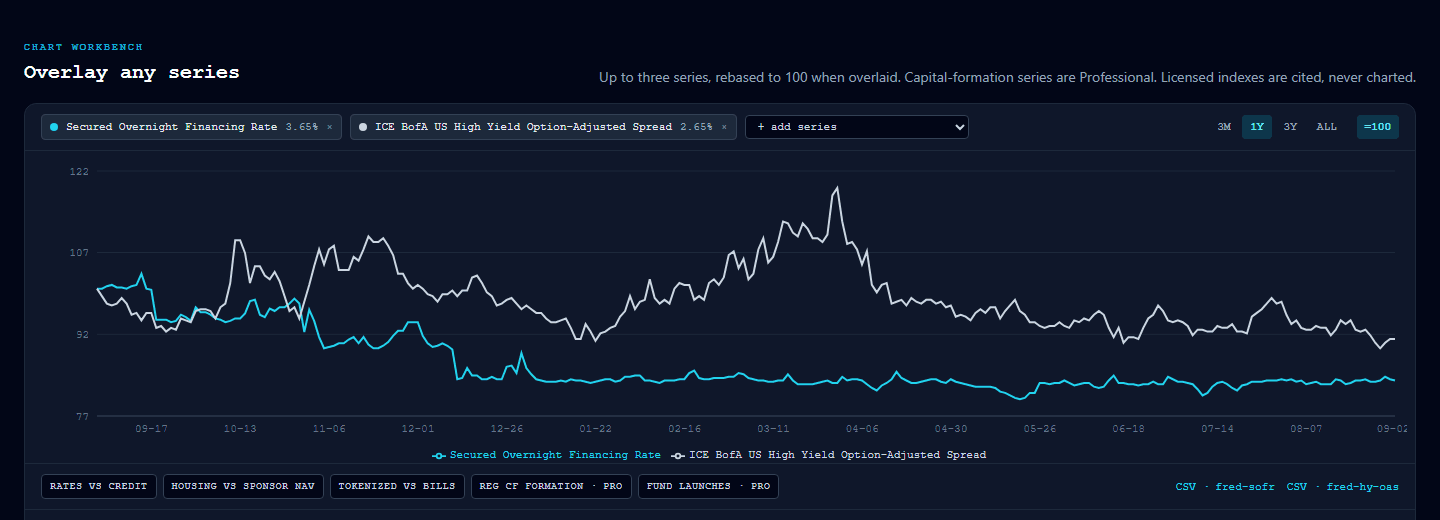
Up to three series on one axis, rebased to 100 when overlaid, with presets for the comparisons investors actually make: rates against credit spreads, housing against sponsor NAV, tokenized yields against bills. Pro saves a chart under a name, shares it by link, and sets an alert when a series crosses a level or moves.
- One axis, fixed hue order, no dual-axis tricks
- Saved charts with public share links
- Threshold and percent-move alerts by email
- CSV for any free series
Categories side by side Free
Reg CF against Reg A, credit against real estate.
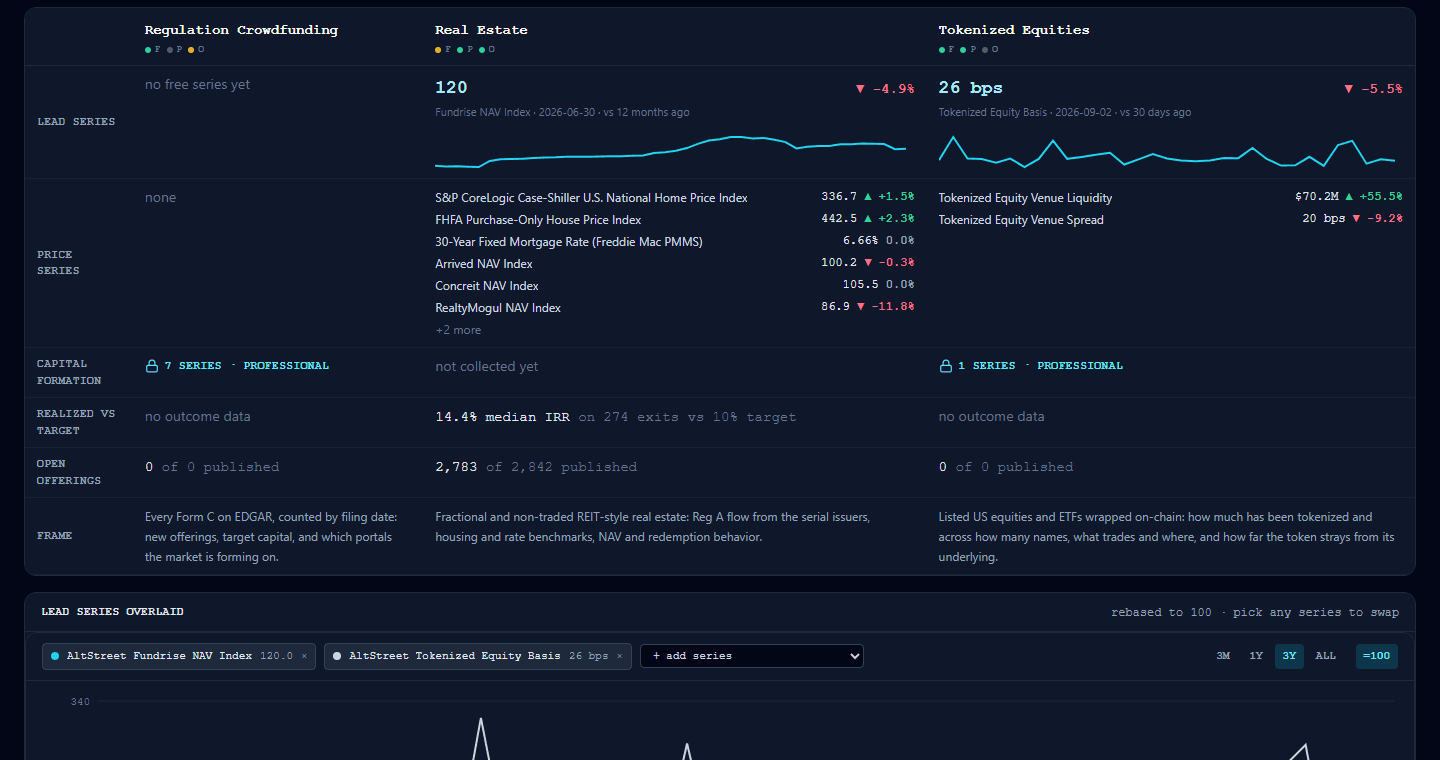
The same normalization at market level. Pick up to four categories and read the same rows for each: the lead series and its change, price benchmarks, realized versus target returns, open offerings and what each layer covers, with the lead series overlaid. The selection lives in the URL, so a comparison is a link.
- 19 market categories on one frame
- Saved compare views in your terminal
- Capital formation shown as a count, opened on the category page
Alt Markets Health Index Free
One number for the whole market.
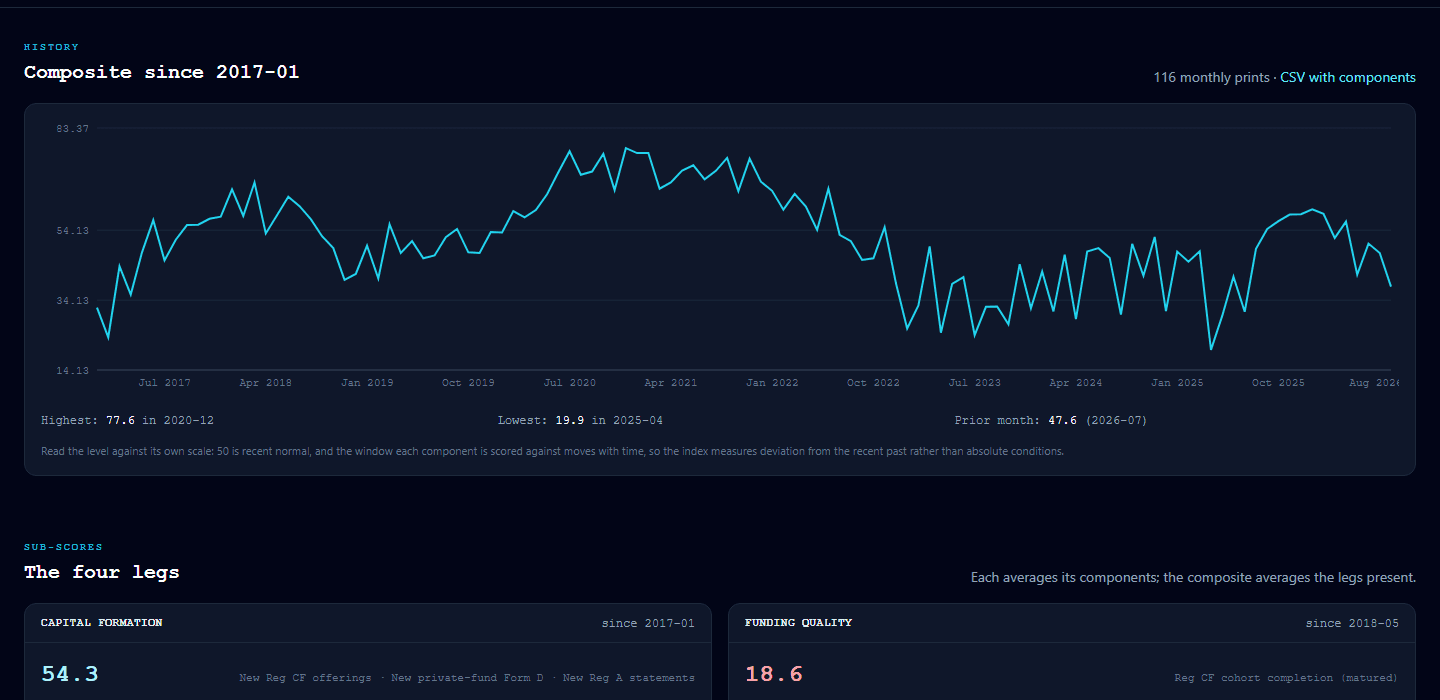
A monthly 0 to 100 composite of the dashboard's own series: capital formation, funding quality, price and liquidity, each scored against its own trailing three years and averaged up. Fifty is recent normal. Every print publishes each component's value, z-score and score, so the index is auditable rather than a black box.
- History since 2017, sub-score paths, component table
- Method in four steps on its own page
- Never includes a licensed index
What the data answers
Questions the filings can settle
AltStreet checks the claim on the platform's site against the offering document and the SEC filing and cites the excerpt: 70,289 verbatim excerpts with page references across 232 deal reviews and 46 platforms, 1132 of them flagged as a discrepancy between what was marketed and what was filed.
See itIt depends on the exemption. Reg CF and Reg A offerings must be filed on EDGAR before they can be marketed, so the filing comes first; Reg D private placements usually appear on the platform first and file within fifteen days of the first sale. AltStreet watches both channels: of 11,250 offerings tracked, 4,233 were first captured from platform sites and 6,919 from SEC filings, each joined to the other record when it arrives.
See itYes. Every platform and offering is mapped onto one schema: fee layers, liquidity terms, hold period, return as disclosed and as realized, audit and governance rows, and the evidence behind each. That is what makes a comparison across asset classes a table rather than an essay.
See itAltStreet monitors 387 platforms and compares the 109 it has reviewed in full on filing-verified rows, fee drag, IRR track error, going-concern language, NAV methodology, with 497 verified exits behind the return rows. The public view shows three platforms; Pro shows every reviewed platform and the deal-level data.
See itAltStreet counts every Form C by SEC filing date from a ledger of 36,456 Form C-family filings covering 11,149 offerings since 2016. The monthly series, the capital sought and the portal breakdown are on the Regulation Crowdfunding page.
See itAltStreet measures it as the share of each monthly cohort that files a Form C-U progress update, required at 50% and 100% of target, and publishes it by cohort and by portal. Portals differ sharply, partly on funding and partly on how strictly they police the filing.
See itNot reliably. AltStreet tracks the share of each funding vintage that files a Form C-AR in the following years from its market-wide ledger; the series shows a steep fall across vintages, and the issuers that do file are profiled on revenue, losses and headcount.
See itAltStreet enumerates pooled-fund Form D notices from a ledger of 637K Form D and D/A filings since 2008, split by fund type and exemption, with the stated offering amounts and the largest raises live now.
See itBoth are enumerated from EDGAR on the same monthly frame, Reg A from 37,433 filings tracked in AltStreet's Reg A lane, and the side-by-side view puts the two categories next to each other.
See itAltStreet sums the circulating market cap of the tokenized treasury products it tracks with a fixed source per product and prints it daily, naming any product missing that day, alongside the realized yield of tokenized treasuries against the 3-month bill.
See itAltStreet tracks a tokenized US-equity universe on one chain and one source and publishes its aggregate market cap and breadth, venue volume and concentration, the token's basis against its underlying, and the spread between venues. Deviations only; no token price is republished.
See itAltStreet's outcome layer holds 497 platform exits with a realized IRR, verified from filings and platform disclosures, and shows the realized median against the median target by category.
See itThe AltStreet Alt Markets Health Index reads 54.0 out of 100 for 2026-09, around recent normal, where 50 is each component's own recent normal.
See itAltStreet chains every filing into an offering timeline, 370,319 of them across Form D, Reg CF and Reg A, each with a status read from the filings themselves (raising, funded, failed, closed, lapsed, dark, reporting) and the reason, and 281,386 typed events along the way: first sales, raises, stalls, auditor changes, bankruptcies. The status and the events are free on every issuer page; velocity, cohort ranking and screening are Pro.
See itAltStreet holds 33,972 enforcement actions, SEC litigation releases and administrative proceedings back to the 1990s and FINRA disciplinary actions, with every respondent resolved to the same entity graph the filings use. An action's existence, date, respondents and link are free on the entity page; bad news is never behind the paywall.
See itForm ADV joins the filings: 24,165 advisers and 46,773 private funds with their auditor, prime broker, custodian, administrator and marketer as filed, and the Form D file number that ties a fund to its offering chain. The engagements are free as filed; the adviser's fund roster at depth and league tables are Pro.
See itEvery related person, sales-compensation recipient and broker-dealer named in a Form D since 2019 resolves to one deterministic id: 362,928 entities, 4,718 of them broker-dealers keyed on CRD, so the same executive or placement agent is one page across every issuer they touch.
See itYes. 649,326 GLEIF records (every US entity, every fund worldwide, Cayman, and their relationship counterparties) with fund-manager, subfund, feeder and parent relationships, linked by exact legal name to 30,780 issuers, advisers, entities and platforms. The identifier prints on the entity page; the parent chain is Investor, hierarchy screening is Pro, and the full link table is licensed to Institutional.
See itThe valuation is not on Form C; it is in the offering memorandum. AltStreet reads each memorandum deterministically and keeps the sentence the figure came from: 2,083 offerings so far with a stated pre-money valuation or a SAFE cap, plus discount, interest rate and price per security, growing as the backfill runs. The instrument and the filing are free; the valuation, cap and evidence sentence are Investor with the deal's other economics.
See itFlow series are AltStreet's own enumeration of EDGAR filings by SEC filing date, never official SEC totals. Platform-reported figures carry that prefix. Licensed indexes are cited with attribution and never charted or exported.
Plans
Free to explore. Investor to investigate. Pro to monitor the market.
Free
$0
Explore the market.
Anyone researching alternative markets.
- Platform reviews, guides, research, the offering database and the EDGAR database
- Platform comparison: the public rows for up to three platforms
- Every issuer, deal, adviser and auditor page: what it is, its filings, its status, and whether something bad happened
- Newly filed offerings by name, the day they file
- Price-layer series, the Alt Markets Health Index, outcome headlines
- Where a claim is verified: the source document, its date, and how many supporting passages exist
- The evidence passages, exact NAV and histories are Investor; feeds, screening, cohorts and export are Pro
Investor
$149/mo
or $1,490/yr, two months free
Investigate what you are considering, with the evidence.
An individual investor doing diligence on the platforms and deals in front of them.
- Everything in Free
- The evidence behind every claim: the verbatim passages from the offering documents and filings, with page references and discrepancy flags
- Exact NAV and the NAV history, distributions and deal economics for the deals you open
- Extracted financial statements, fee stacks, borrower and sponsor history, valuation history
- Full platform detail for every reviewed platform, one at a time
- Watch up to 25 issuers or platforms and get filing alerts on them
- Market-wide screening, the complete deal feed, cohort analytics, capital formation and CSV export are Pro
Pro · the whole terminal
$349/mo
or $3,490/yr, two months free
Monitor and analyze the entire alternative market.
Advisers, allocators, researchers, journalists and operators who work across the market.
- Everything in Investor
- Market-wide screening: find every offering, issuer, adviser or auditor that meets a condition, ranked by cohort and velocity
- Platform comparison at depth: every tracked platform, deal-level returns, fee forensics, going-concern and NAV-methodology rows, IRR history
- Deal flow: every new Reg CF, Reg A and private-fund filing market-wide, the day it files, with the issuer's numbers, open offerings and issuer trails
- Capital formation: filing counts and amounts, portal share, cohort completion, compliance and issuer health, with the breakdown behind every print
- Outcome tables: realized versus promised by platform, fee stacks, NAV tables, cohort breakdowns
- Daily filing watches, series alerts, saved charts with share links, compare views, the weekly digest
- CSV export of any servable series
- One seat. Licensed indexes (Liv-ex, Hiive50) stay cited, never exported: their terms, not ours
Institutional
Custom
annual, invoiced, five or more seats
Pro for a team, on your paper.
Advisory firms, platforms, funds, media and research desks.
- Everything in Pro, for five or more seats
- Invoiced annually, procurement-friendly
- Priority data requests: a series, breakdown or platform you need, scoped and scheduled
- Internal redistribution license for AltStreet-derived series in your own reports and models
- A named contact for methodology questions
- Provisioned by hand within one business day of agreement
Other ways to buy
Deal Intelligence
The Terminal is pull: you ask the data. Deal Intelligence is push: AltStreet tells you the day a new offering appears on a covered platform and follows with the analyst-approved committee memo. Annual, from $3,500.
Let AltStreet watch the marketResearch Desk
One bounded result on one offering, commissioned by the investor. Diligence Check $750 in two business days; Diligence Report $1,495 in three to five; custom engagements quoted. No subscription needed.
Commission diligenceInvoice or purchase order
Annual terms for teams and firms, named seats, vendor onboarding and security questionnaires handled, no card required.
Request an order formPricefeed API
The tokenized-stock pricefeed is a separate API product with its own plans and keys.
Pricefeed plansDescriptive data for research; not investment advice and not a recommendation of any offering or platform. Programmatic access to terminal data is not offered on a published plan yet; institutions can ask for it on the order form.
Buying AltStreet
The commercial questions, answered in prose
How much does AltStreet Terminal cost?
Free covers the research hub, every entity, deal, adviser and auditor page, newly filed offerings and the public comparison rows, with no card. Investor is $149 a month or $1,490 a year and adds the evidence passages, exact NAV and histories, extracted financials and watchlists. Pro is $349 a month or $3,490 a year and adds the whole market: feeds, screening, cohorts, the entity graph and export. Institutional is Pro for a team, priced per seat on an annual invoice. Prices are in US dollars and monthly plans cancel any time.
Can I buy a single report instead of a subscription?
Yes. A Diligence Check on one offering is $750 and returns in two business days; a full Diligence Report is $1,495 in three to five business days; multi-entity engagements are quoted by scope. Reports are commissioned by the investor, never by the issuer, and the commission never changes AltStreet's published coverage. Terminal access is not required.
How do institutions, funds and firms buy?
By invoice or purchase order on an annual term, with as many named seats as the team needs, through the order form at /terminal/order. Security questionnaires, vendor onboarding forms and custom terms go through the same form. Card checkout remains available for a single Investor or Pro seat.
Is there an API or bulk export?
Pro includes export of the screens and series a subscriber builds, as CSV. A data API exists and is not yet offered on a published plan; institutions that need programmatic access can ask for it on the order form. The tokenized-stock pricefeed is a separate API product with its own plans.
Can AltStreet replace Preqin, PitchBook or an investor database such as altss?
For different questions. Investor databases tell you who to call: contacts, mandates and relationships. AltStreet tells you what a platform, fund or issuer actually did: what it filed, what it sold, to how many investors, what it charges, what it returned, and where its marketing and its filings disagree, with the passage cited. Teams that use both use the database to find the counterparty and AltStreet to check the record before the meeting.
Is there a free trial?
The Free tier is the trial: it is the full research hub and every public record page, without a time limit. The paid tiers unlock the evidence and the market-wide views on top of it, and a monthly plan can be cancelled in the first month.
Where does the data come from, and is any of it licensed?
SEC EDGAR filings, offering documents, platform websites captured with the date read, Form ADV and broker-dealer records, court and enforcement records, public pension disclosures and market data feeds. Licensed indexes are cited with attribution and never charted or exported. Nothing on AltStreet is investment advice.
What is where
Free, Investor and Pro, line by line
| Surface | Free | Investor | Pro | Institutional |
|---|---|---|---|---|
| Reviews, research, the offering and EDGAR databases, every issuer, deal, adviser and auditor page | ||||
| Newly filed offerings by name; critical events (bankruptcy, non-reliance, going concern, enforcement) with the filing | ||||
| Platform comparison: public rows, three platforms | ||||
| Price-layer series, chart workbench, Alt Markets Health Index, outcome headlines | ||||
| That a claim is verified: source document, date, number of supporting passages | ||||
| Evidence drilldown: the offering-document and filing excerpts, page references, discrepancy flags | · | |||
| Exact NAV and NAV history, deal economics, extracted financial statements, fee stacks | · | |||
| Full detail for any reviewed platform, one at a time; return history per deal | · | |||
| Watches and filing alerts on up to 25 issuers or platforms | · | |||
| Platform comparison at depth: every platform side by side, deal-level returns, fee forensics | · | · | ||
| Deal flow: the complete feed, filters, velocity, intermediary, cohort flags | · | · | ||
| Market-wide screening, cohort analytics, capital-formation series with breakdowns | · | · | ||
| Outcome tables by platform, NAV screening, comparables across the universe | · | · | ||
| Unlimited watches, series alerts, weekly digest, saved charts, share links, CSV export | · | · | ||
| Five or more seats, invoicing, priority data requests, internal redistribution licence | · | · | · |
The filing, the document, and the pitch. Read together.
Start on the free terminal. Everything paid is enforced in the data layer, so what you see free is real, what Investor opens is the evidence and history behind it, and what Pro adds is the same data across the whole market.